Seeing A* Pathfinding in Action
Pathfinding algorithms are everywhere—running behind the scenes in our GPS apps, guiding NPCs in video games, and routing delivery trucks. But actually understanding how they work can feel a bit abstract until you see them in motion.
That's the idea behind this project: making the famous A* algorithm visual. Instead of staring at pseudocode or terminal outputs, you get to watch the decision-making happen live. You can see how the algorithm explores a grid, encounters obstacles, and eventually snakes its way from start to finish.
Let's break down what's actually happening on screen and how building a visualizer like this works.
Why visualize algorithms anyway?
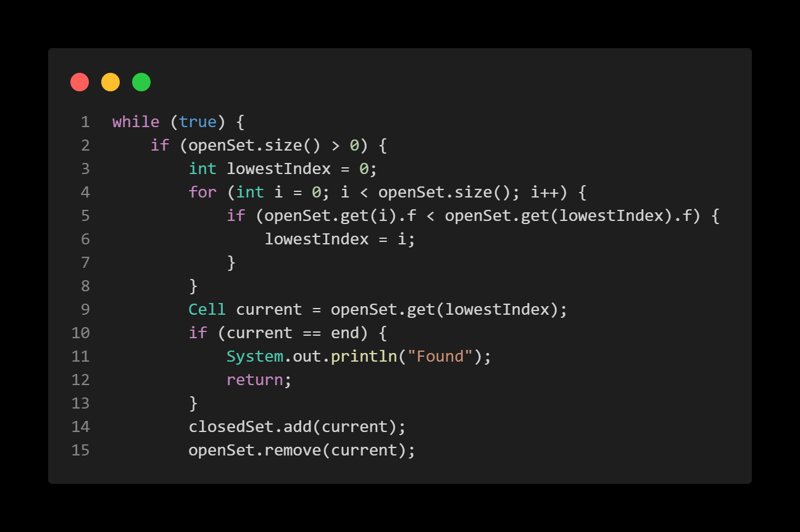
At its core, my A-Star-Visualization project has two main jobs: 1. Actually run the A* search on a grid. 2. Animate that process step-by-step.
That second part is the fun part. Watching the "frontier" of explored nodes expand outward makes a lot of dry computer science concepts immediately click:
- You see exactly why the algorithm prefers "promising" paths over just blindly expanding outward.
- You can watch it get "stuck" in a dead end and backtrack.
- You instantly grasp why choosing a different heuristic completely changes the algorithm's behavior.
The gist of A*
If I had to describe A* in a few words, I'd say it's basically Dijkstra's algorithm, but with a compass pointing toward the destination.
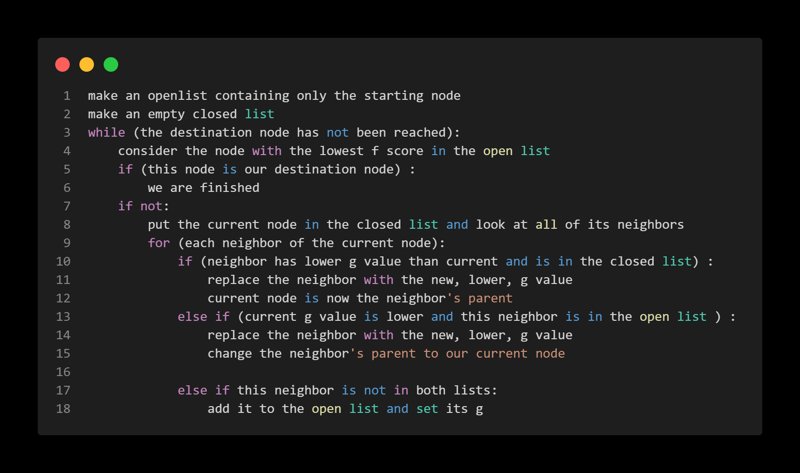
It tries to find the absolute shortest path by giving every possible next step a score. That score is calculated using a simple formula:
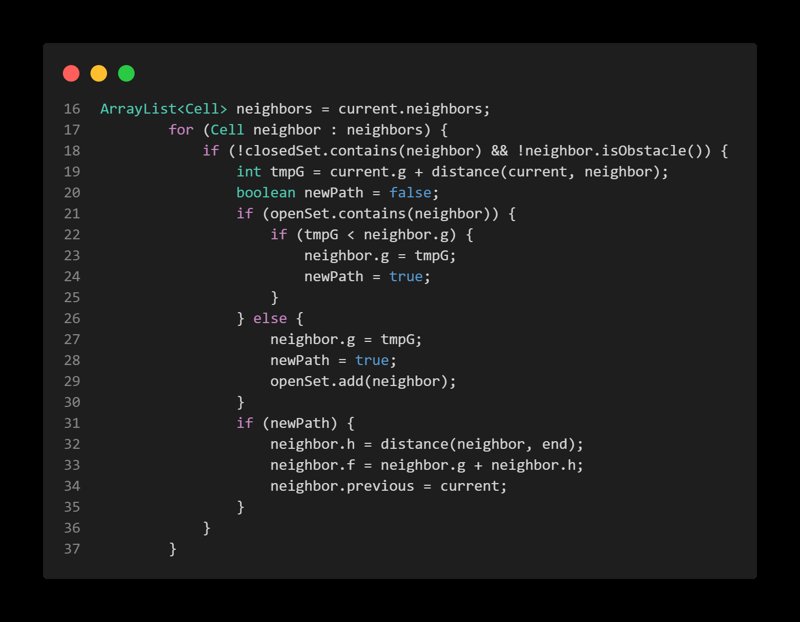
- g(n): The actual cost it took to get to this node from the start.
- h(n): Our "best guess" (heuristic) of how much further it is to the goal.
- f(n) = g(n) + h(n): The total estimated cost.
A always wants to explore the node with the lowest f score next. As long as our guess (the heuristic) doesn't overestimate the remaining distance, A guarantees it will find the best path, while usually checking way fewer dead-ends than a blind search.
Anatomy of the Visualizer
If you've played around with pathfinding visualizers before, you'll recognize a few familiar elements here:
The Grid
Everything happens on a 2D map. Breaking the world into a grid makes moving around really straightforward—you just check your immediate neighbors (up, down, left, right).
Walls and Obstacles
Without obstacles, pathfinding is boring. Throwing walls into the mix is where you really see A* shine. You can watch it smoothly route around a barrier rather than helplessly bumping into it or flooding the whole map.
The Frontier (Open vs. Closed sets)
This is where the magic happens visually. As the algorithm runs, you'll see nodes split into two categories: - Open set (the frontier): Nodes we know about but haven't explored yet. - Closed set: Nodes we've fully checked out.
Color-coding these states makes it easy to see the algorithm "thinking" in real time.
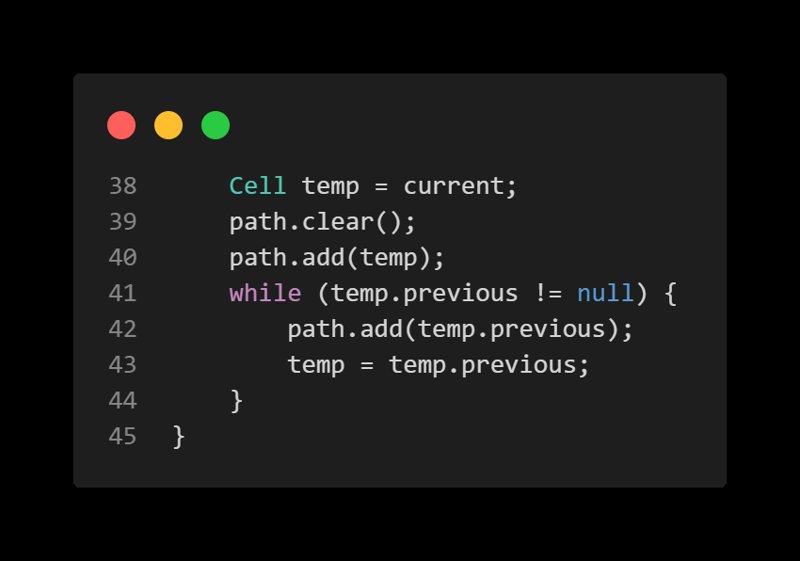
The Final Route
Once the target is found, the algorithm works backwards to trace the shortest path home. Watching that final route snap into place is incredibly satisfying.
Under the Hood
You don't need to write a million lines of code to build one of these. It usually comes down to managing a few core pieces well:
Keeping track of nodes
Every single cell on the grid needs to know a few things about itself: where it is, whether it's a wall, its current f, g, h scores, and who its "parent" node is (so we can trace the final path backward).
Deciding what to do next
Because A* always needs the node with the lowest f score, the easiest way to handle the "open set" is with a Priority Queue. It keeps things fast and organized so the algorithm runs smoothly even on a large grid.
Playing with heuristics
How we guess the distance to the goal makes a massive difference in how the search behaves.
-
Manhattan distance: Great when you can only move in four directions (like navigating city blocks).
-
Euclidean distance: The literal "as the crow flies" straight line.
If you have a strong heuristic, A* looks laser-focused. If your heuristic is weak, it starts to look like a wildly expanding wave.
Stepping through time
Instead of just teleporting to the end result, the visualizer uses an animation loop. We process just one node expansion per frame, which turns an instant calculation into an engaging animation.
Making it interactive
Building the algorithm is one thing, but making the visualizer actually fun to use comes down to interaction.
The best part of a project like this is letting someone draw their own walls, pick custom start and end points, and watch the algorithm figure out the puzzle they just created.
## Attachments